Funnel Analysis
You can use the data of logs generated by the BACKND method InsertLog for funnel analysis.
Funnel analysis is a method of analyzing the completion rate and the conversion rate of users in events. This method earned its name due to the form it ultimately takes. The developer creates logs each time a user completes a specific event and gathers the data using the funnel analysis method to easily find critical sections where many users leave.
This documentation guides the developers on how funnel analysis works through an early-game tutorial scenario.
1. Create logs
1-1. The developer defines a data named tutorial_complete in an action type log called TutorialLog.
1-2. At the beginning of the game, users proceed with a total of 20 tutorials, from "Tutorial #1" to "Tutorial #20." Each time a user completes Tutorial #N, the value of tutorial_complete creates a log named "Tutorial #N," and this means that there is a total of N logs for the user.
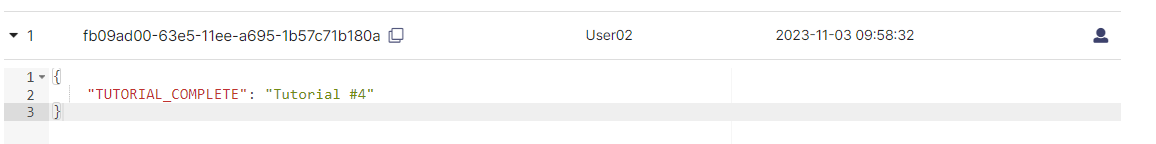
You can register the log in Unity like below.
public void InsertLogTutorialComplete(int stage)
{
    string logContent = "Tutorial #" + stage;

    Param param = new Param();
    param.Add("tutorial_complete", logContent);

    Backend.GameLog.InsertLog("TutorialLog", param);
}
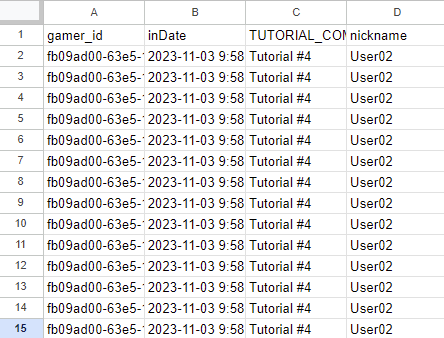
The figure below will be shown upon downloading and opening it as a CSV file.
Caution
2. Look up funnels
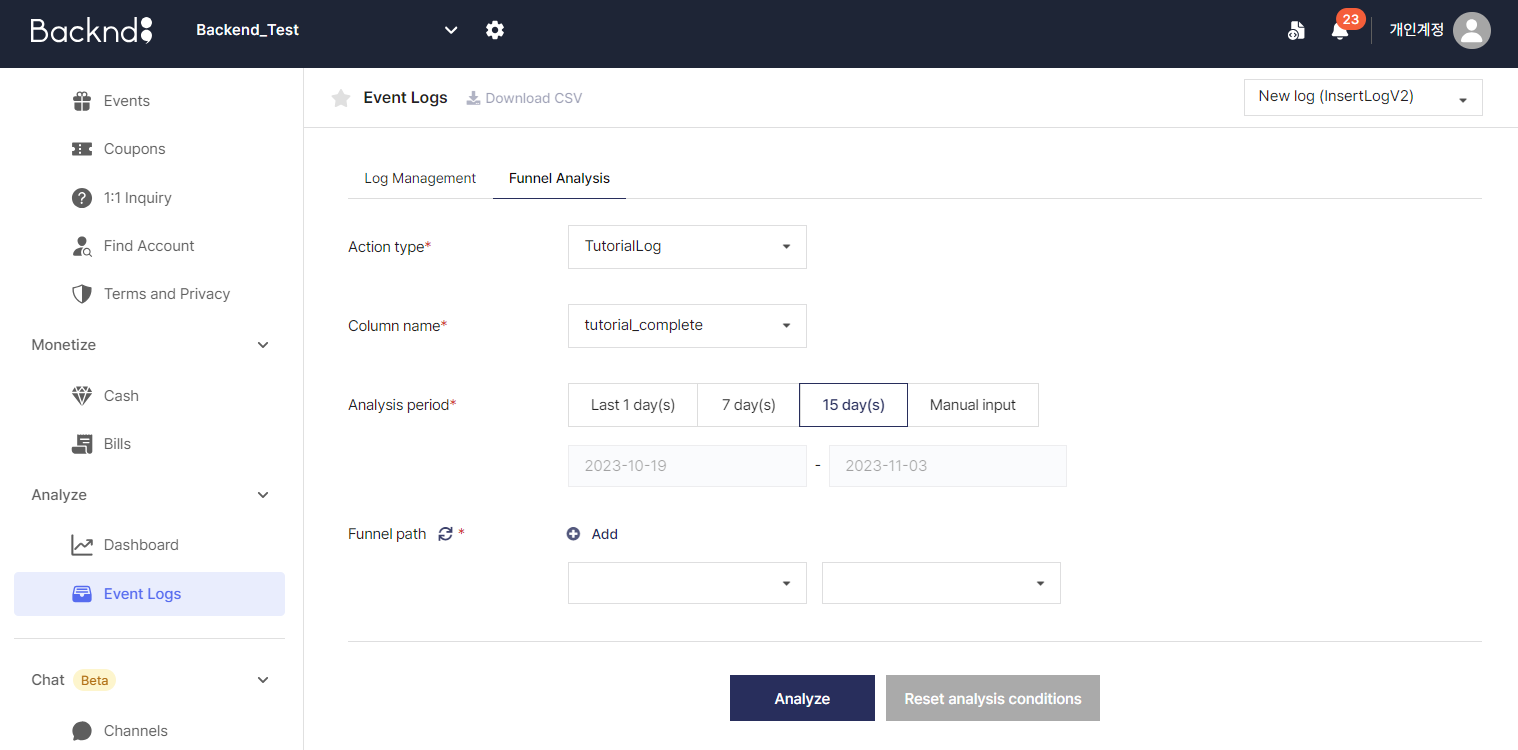
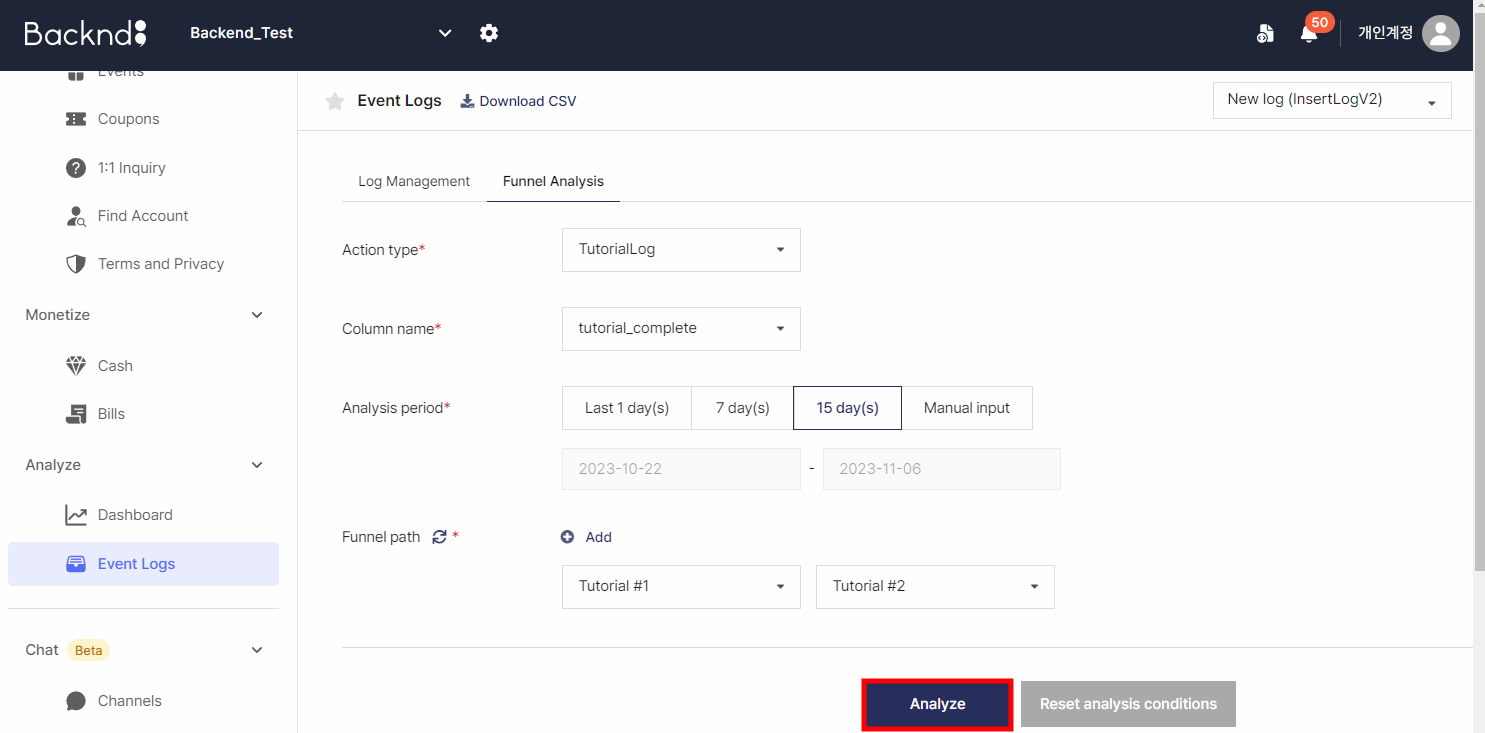
2-1. Set the action type to TutorialLog and the column name to tutorial_complete. If you have defined the data of the same action type in different names, you can look them up by changing the column names.
You can choose 1 day, 7 days, and 15 days from the current time for the duration and set the desired duration via "Enter Manually."
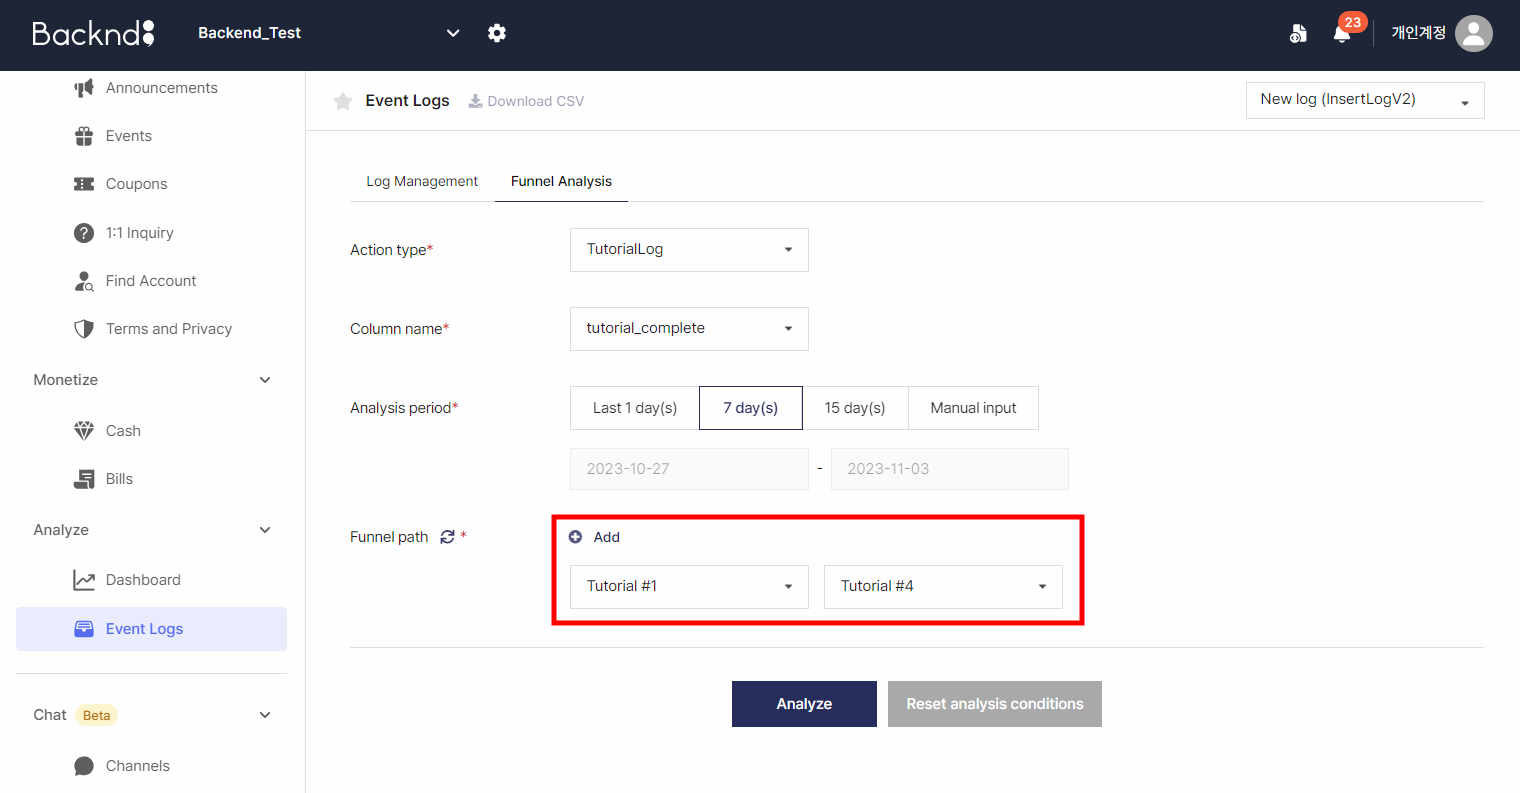
2-2. The developer may want to know the percentage of users who completed 10 out of 20 tutorials. In this case, set the first funnel to "Tutorial #1" and the second to "Tutorial #10."
Refreshing funnels
3. Analyze funnels
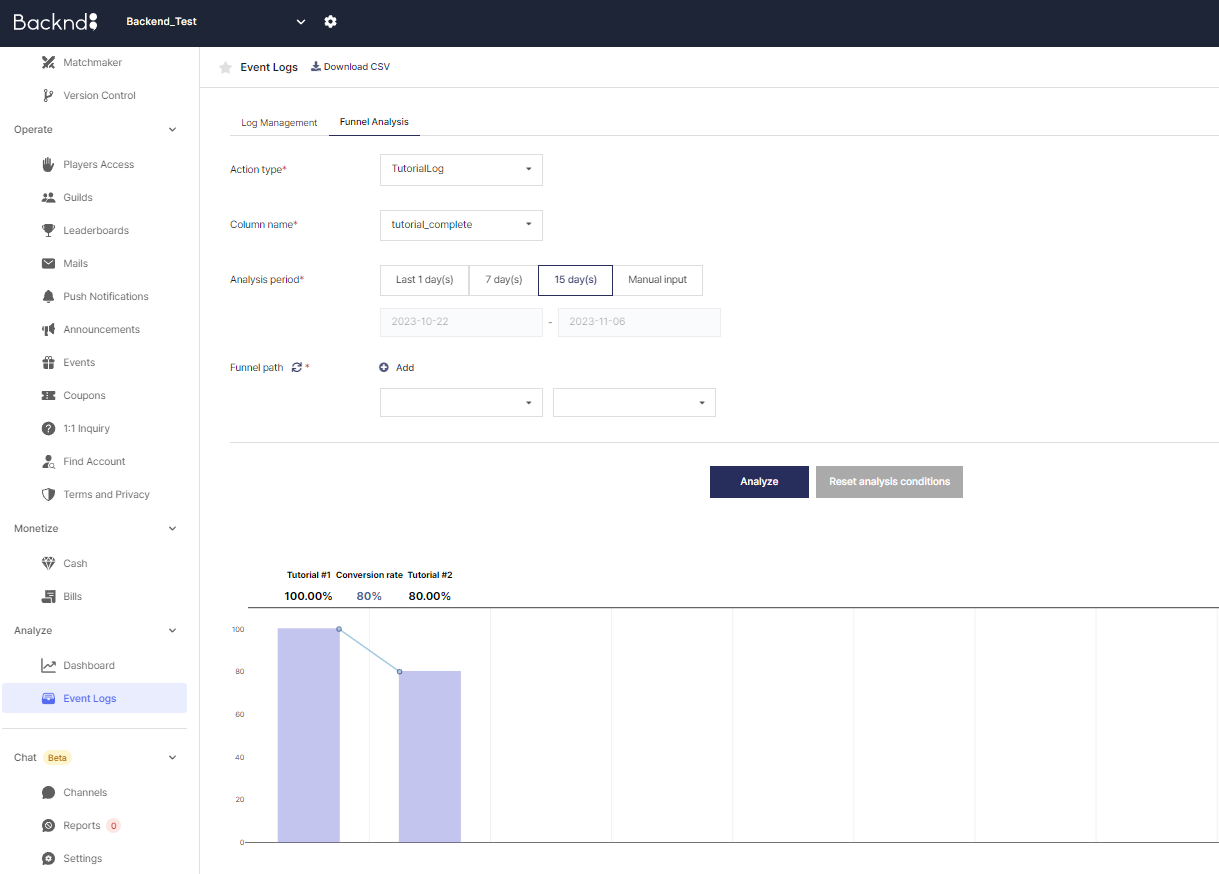
3-1. You can click the "Analyze" button to check the analysis results.
The value printed under the funnel name is the percentage of log quantity for the funnel in comparison with the first funnel. If the number of users who created the "Tutorial #1" log is 10,000, the number of users who created the "Tutorial #10" log is 2,148.
In this virtual data, only 21% of users completed the first ten tutorials. Developers can change funnels and analyze them to find the exact cause of leaving.
3-2. This time, the funnels will be set from "Tutorial #1" to "Tutorial #5" in order and analyzed.
The conversion rate is the percentage of users from the previous step who also created the log for the next step. We can see that among users who passed Tutorial 2, 81% of them also passed Tutorial 3. This data tells us that Tutorial 3 is the cause of users leaving.
However, this does not fully explain why only 21% of the users go through all 10 tutorials.
3-3. We will expand the funnel's range and perform an additional analysis.
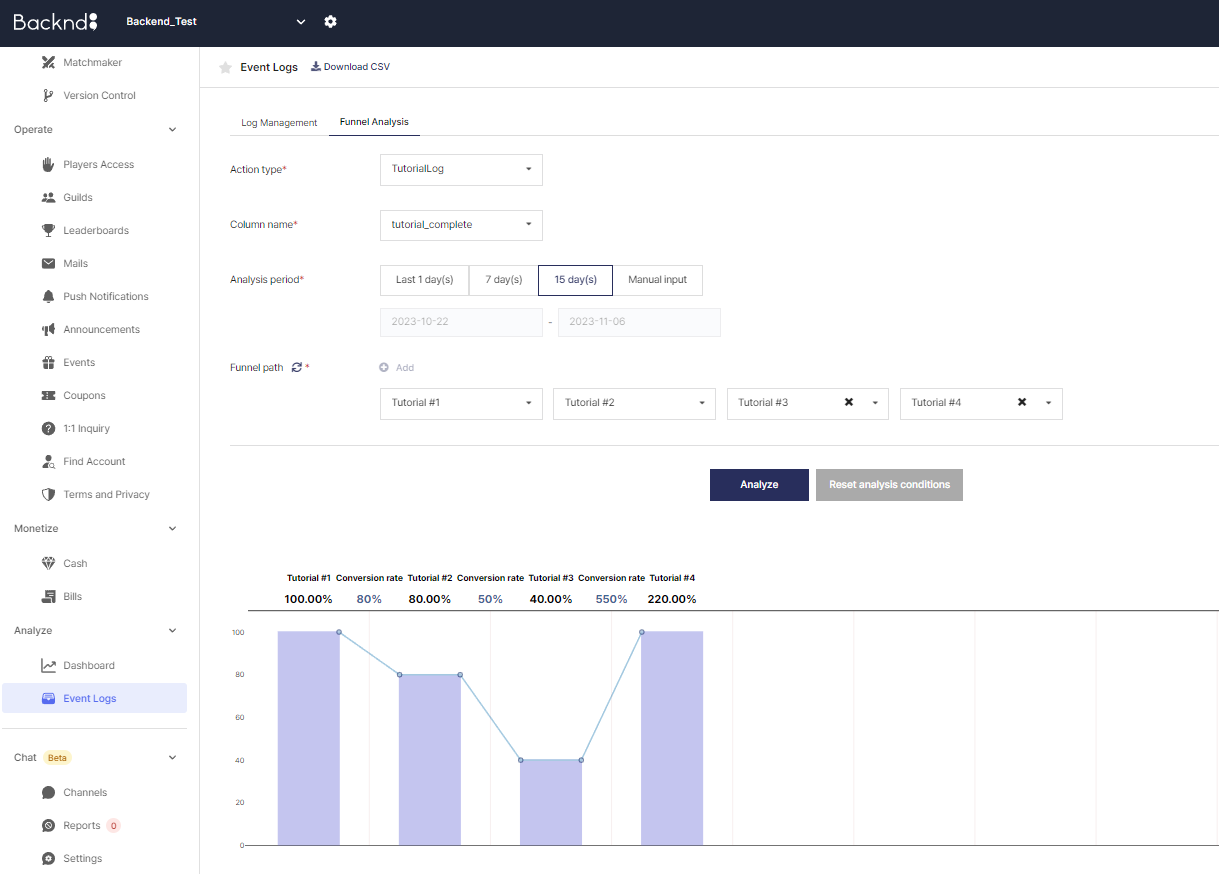
The conversion rate between "Tutorial #5" and "Tutorial #6" is 39%. The developer will see this and assume that Tutorial 6 harbors the critical reason that stops users from continuing.
Normally, bugs and tedious planning and designs are the main causes of users leaving a game. Developers can check the trends of changes and improve user experience after updating their games by analyzing funnels.